


Investments
Target Net Annual Return
1
10%-15%
Target Net Annual Appreciation
1
5%-8%
Target Net Annual Yield
1
5%-7%
Investment Objective
Income + Growth
IRA Eligibility
Eligible
Asset Type
Residential + Commercial
Minimum Investment
$100K
Investments
Target Net Annual Yield1
Target Net Annual Return1
Investment Objective
Minimum Investment
IRA Eligibility
Target Net Annual Appreciation1
Asset Types
5%-8%
5%-7%
10%-15%
$100K
Eligible
Income + Growth
Residential + Commercial
Fund Benefits
Passive income & appreciation + strategic short-term opportunities
This private real estate Fund is for the moderate-risk investor seeking both income and appreciation in a single vehicle. The Fund’s primary strategy is to buy and finance multifamily properties in its target markets while also using strategic applications of leverage to harness short-term commercial opportunities for outsized capital appreciation.

INCOME
The Fund strives to generate a stable stream of monthly distributions.

APPRECIATION
The Fund presents long-term capital appreciation potential that can be compounded further by participating in the Fund’s distribution reinvestment program.

TAX EFFICIENCY
The Fund is structured as a limited liability company. Most of the Fund’s payments to its owners are expected to be either non-wage distributions, or a return of capital, which is non-taxable.
2
Fund Benefits
Passive income & appreciation + strategic short-term opportunities
This private real estate Fund is for the moderate-risk investor seeking both income and appreciation in a single vehicle. The Fund’s primary strategy is to buy and finance multifamily properties in its target markets while also using strategic applications of leverage to harness short-term commercial opportunities for outsized capital appreciation.
INCOME
The Fund strives to generate a stable stream of monthly distributions.
APPRECIATION
The Fund presents long-term capital appreciation potential that can be compounded further by participating in the Fund’s distribution reinvestment program.
TAX EFFICIENCY
The Fund is structured as a limited liability company. Most of the Fund’s payments to its owners are expected to be either non-wage distributions, or a return of capital, which is non-taxable. 2
Generate More Income

The net tax-free distribution yield for the Bright+ Fund now stands at over 6%. That's a taxable equivalent yield of 7.3-8% (depending on your tax bracket), Approximately 35% more than the 10-Year U.S. Treasury yield and 60% more than investment-grade bonds.
3
4
Generate More Income
The net tax-free distribution yield for the Bright+ Fund now stands at over 6%. (3)
That's a taxable equivalent yield of 7.3-8% (depending on your tax bracket), Approximately 35% more than the 10-Year U.S. Treasury yield and 60% more than investment-grade bonds. (4)

Pro Forma Growth
Since the funds inception in 2019 it has achieved a nearly 1.89x multiple today. That’s 89% growth over five years.
The Fund is split between of pool of investments, 70% in residential multifamily real estate and 30% in commercial real estate and harnessing short-term cash implementation opportunities.
Our Residential investments have averaged an annual 6% cash yield and 8% appreciation for a 14% total annual yield while our commercial and short-term opportunities have averaged 5% cash yield and 22% appreciation for a total annual yield of 27%.
5
Growth of a $250K Bright+ Fund Investment Since Inception

Pro Forma Growth
Since the funds inception in 2019 it has achieved a nearly 1.89x multiple today. That’s 89% growth over five years.
The Fund is split between of pool of investments, 70% in residential multifamily real estate and 30% in commercial real estate and harnessing short-term cash implementation opportunities.
Our Residential investments have averaged an annual 6% cash yield and 8% appreciation for a 14% total annual yield while our commercial and short-term opportunities have averaged 5% cash yield and 22% appreciation for a total annual yield of 27%. (5)
Growth of a $250K Bright+ Fund Investment Since Inception

Tax Efficiency
The Fund has a limited liability company, which provides tax benefits. Including simplifying tax preparation by eliminating the need to make multiple state tax filings even though the Fund owns properties in multiple states.

RETURN OF CAPITAL
A portion of the Fund’s monthly distributions are expected to be characterized as a return of capital, which is not subject to tax.
6
DEFERRAL OF CAPITAL APPRECIATION AND ESTATE PLANNING
Investors benefit from an indefinite deferral of capital appreciation for as long as the investment is held. If the investment is held until death, the beneficiaries of the investor will benefit from a step-up in cost basis.
Tax Efficiency
The Fund has a private REIT structure, which provides tax benefits. Including simplifying tax preparation by eliminating the need to make multiple state tax filings even though the Fund owns properties in multiple states.
RETURN OF CAPITAL
A portion of the Fund’s monthly distributions are expected to be characterized as a return of capital, which is not subject to tax.6
Investors benefit from an indefinite deferral of capital appreciation for as long as the investment is held. If the investment is held until death, the beneficiaries of the investor will benefit from a step-up in cost basis.
DEFERRAL OF CAPITAL APPRECIATION AND ESTATE PLANNING
Bright + Fund Portfolio Allocation

Leverage
We use leverage sparing to harness short-term opportunities and increase risk-adjusted returns on our residential properties.
Our long-term target is 25-30% leverage with a short/medium- term maximum of 50% depending on the availability of harnessing short-term opportunities.
We strategically manage the Fund’s portfolio allocation, seeking stability across all market cycles.
Residential + Multifamily
High income-producing, long-term investments with moderate appreciation.
Commercial Real Estate
Short-term opportunities are harnessed as they appear in the market. Lower income, higher appreciation.
Bright + Fund Portfolio Allocation
We strategically manage the Fund’s portfolio allocation, seeking stability across all market cycles.

High income-producing, long-term investments with moderate appreciation.
Residential + Multifamily
Short-term opportunities are harnessed as they appear in the market. Lower income, higher appreciation.
Commercial Real Estate
Leverage
We use leverage sparing to harness short-term opportunities and increase risk-adjusted returns on our residential properties.
Our long-term target is 25-30% leverage with a short/medium- term maximum of 50% depending on the availability of harnessing short-term opportunities.

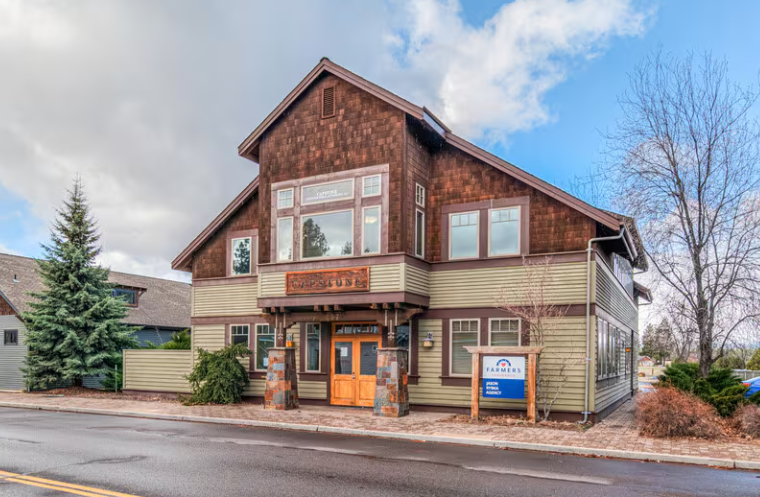
Where We Invest
We target cities and submarkets across the Western U.S that we expect to experience rent growth and investing demand.
CURRENT MARKET
Oregon
Idaho
FUTURE MARKETS
Investment Expertise
Washington
Montana
Wyoming
BOOTS-ON-THE-GROUND
Utah
Nevada
Our approach to target market selection starts with our experts’ in-depth knowledge of local market fundamentals. We look for places where employment and demographic trends point to future opportunity.
We understand that real estate markets are always evolving, and we evaluate the best places to invest on an ongoing basis, acting when the right signals are present.
Where We Invest

We target cities and submarkets across the Western U.S that we expect to experience rent growth and investing demand.
CURRENT MARKET
Oregon
Idaho
FUTURE MARKETS
Washington
Montana
Wyoming
Utah
Nevada
Investment Expertise
BOOTS-ON-THE-GROUND
Our approach to target market selection starts with our experts’ in-depth knowledge of local market fundamentals. We look for places where employment and demographic trends point to future opportunity.
We understand that real estate markets are always evolving, and we evaluate the best places to invest on an ongoing basis, acting when the right signals are present.
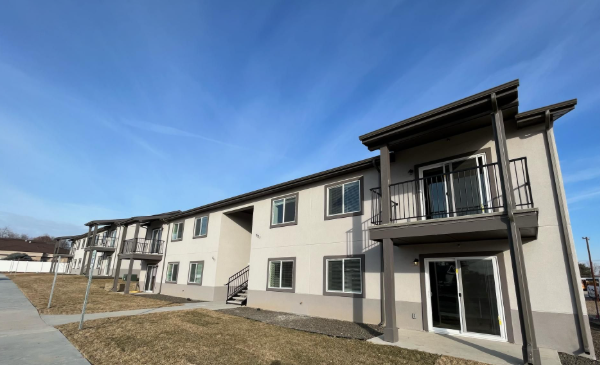
Fund Properties
42
Residential units
09
Multi-family Buildings
08
Commercial Properties
03
Installment Notes
150
Total Units/Doors
Fund Properties
42
09
08
03
Multi-family Buildings
Residential units
Installment Notes
Commercial Properties
150
Total Units/Doors
-
![]()
Redmond, OR
-
![]()
Sister, OR
-
![]()
Nampa, ID
-
![]()
Caldwell, ID


-
![]()
Redmond, OR
-
![]()
Sister, OR
-
![]()
Nampa, ID
-
![]()
Caldwell, ID

Get Bright+ Fund Documents
Gain access to our due diligence materials and learn more about our:

FUND STRATEGY
FUND DEALS
FUND TERMS
Get Bright+ Fund Documents
Gain access to our due diligence materials and learn more about our:
FUND STRATEGY
FUND DEALS
FUND TERMS
Targeted performance doesn’t represent an actual investment and frequently has sharp differences from actual returns. Targeted returns are inclusive of appreciation and reinvestment of distributions and are net of fees. There can be no assurance that the Fund will achieve comparable results or meet its target returns.
A return of capital is non-taxable but lowers an investor’s basis in their investment.
The net distribution yield is as of 11/30/24 and is calculated as the (November 2024 distribution divided by equity invested) divided by the (30 days in the month divided by 365 days in the year.)
As of 1/10/25, the distribution yield of the U.S. 10-Year Treasury Note was 4.67% and the distribution yield of Moody’s Seasoned AAA Corporate Bonds was 5.54%, according to YCharts.)
The investment period is from 1/01/2019 to 1/01/2025. Returns are inclusive of appreciation and reinvestment of distributions and are net of fees. An investment in the Fund has the potential for partial or complete loss of funds invested. Returns are not guaranteed. Past performance is no guarantee of future results. All investments involve a degree of risk, including the risk of loss.
The return of capital will lower an investor’s basis in the Fund. When an investor sells their interest in the Fund, any gains will consider the selling price relative to the cost basis. Accordingly, the return of capital is a deferral of some of the investor’s tax liability.